Worked solutions - Quiz 5

This page contains sketch notes to some of the quiz questions from Quiz 5. It is not comprehensive. We have tried to include most of the questions where it may not be obvious how to get to the correct answer.

Question 6

It’s useful to draw a probability tree (see the figure below below). Basically, you want to start in the left-hand box (alive at age 50) and end up in the “alive at age 80” box. This involves following three arrows. Because each of these paths need to happen (i.e. these are intersections not unions), you multiply the probabilities of following the three arrows you need to follow.

\[\begin{split} \begin{align*} Pr(\mbox{Survive to 80} | \mbox{alive at 50}) & = Pr(\mbox{Survive to 60} | \mbox{alive at 50}) \\ & \times Pr(\mbox{Survive to 70} | \mbox{alive at 60}) \\ & \times Pr(\mbox{Survive to 80} | \mbox{alive at 70}) \\ & = 0.95 \times 0.85 \times 0.8 = 0.646 \end{align*} \end{split}\]
_images/Diagram_prob_tree_deadman.png

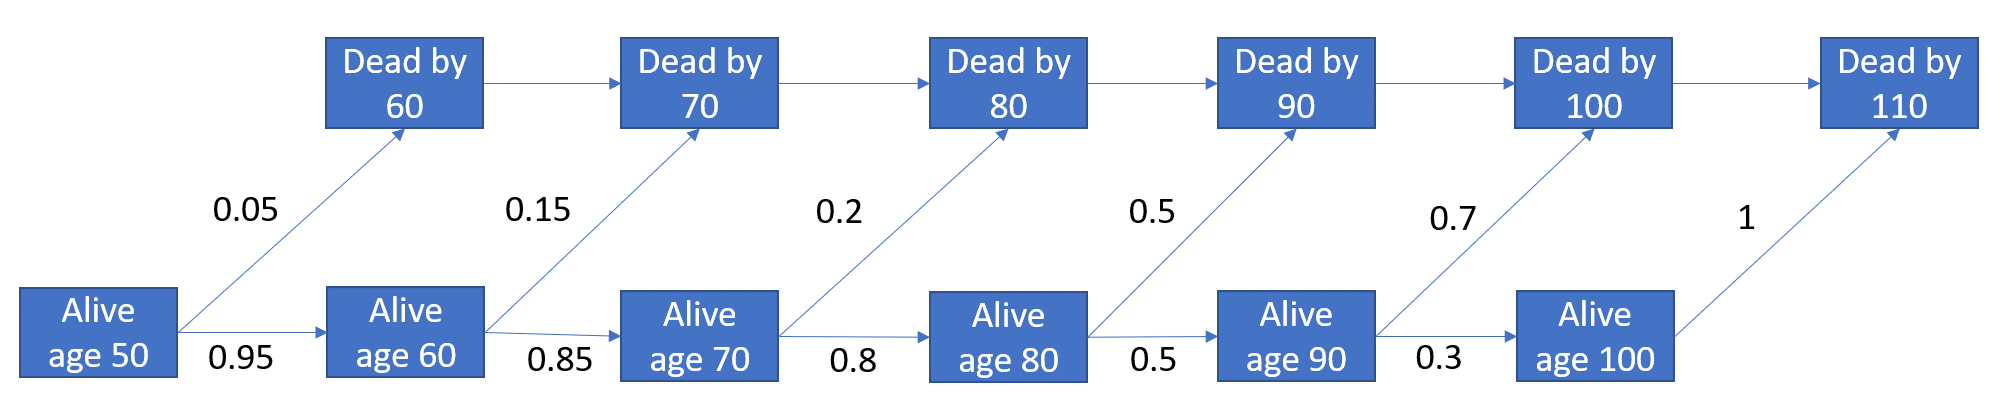
Fig. 7 Probability tree - survival experience of 50-year old, Quiz 5, questions 6-7

Question 7

In the probability tree, there are two ways of dying between 70 and 90, for someone who is alive at age 50. Either they survive the first and second decade, and then die (between 70 and 80), or they survive the first, second and third decade and then die (between 80 and 90). Because this is a union of disjoint events (one or the other can happen but not both), we add the two probabilities. To get each of those two probabilities, again we multiply all the probabilities attached to arrows we need to follow to get to where we are going.

\[\begin{split} \begin{align*} & Pr(\mbox{Die between 70 and 90} | \mbox{alive at 50}) \\ & = Pr(\mbox{Die between 70 and 80} \cup \mbox{Die between 80 and 90} | \mbox{alive at 50})\\ & = Pr(\mbox{Die between 70 and 80} | \mbox{alive at 50}) + Pr(\mbox{Die between 80 and 90} | \mbox{alive at 50}) \\ & = Pr(\mbox{Survive to 60} | \mbox{alive at 50}) \times Pr(\mbox{Survive to 70} | \mbox{alive at 60}) \times Pr(\mbox{Die between 70 and 80} | \mbox{alive at 70}) \\ & + Pr(\mbox{Survive to 60} | \mbox{alive at 50}) \times Pr(\mbox{Survive to 70} | \mbox{alive at 60}) \times Pr(\mbox{Survive to 80} | \mbox{alive at 70})\\ & \times Pr(\mbox{Die between 80 and 90} | \mbox{alive at 80}) \\ & = (0.95 \times 0.85 \times 0.2) + (0.95 \times 0.85 \times 0.8 \times 0.5) = 0.4845 \end{align*} \end{split}\]

Question 8

In the probability tree (Figure below), there are two ways of being 30+ and not hospitalised with COVID: being 30-69 and not hospitalised, or being 70+ and not hospitalised. These are disjoint events (one or the other can happen, but not both) so we sum their probabilities to obtain the probability of the union.

\[\begin{split} \begin{align*} Pr(Age_{30+} \cap \bar{H}) & = Pr((Age_{30-69} \cup Age_{70+}) \cap \bar{H}) \\ & = Pr(Age_{30-69} \cap \bar{H}) + Pr(Age_{70+} \cap \bar{H}) \\ & = Pr(Age_{30-69}) Pr(\bar{H} | Age_{30-69}) + Pr(Age_{70+}) Pr(\bar{H} | Age_{70+}) \end{align*} \end{split}\]
_images/Diagram_prob_tree_hosp.png

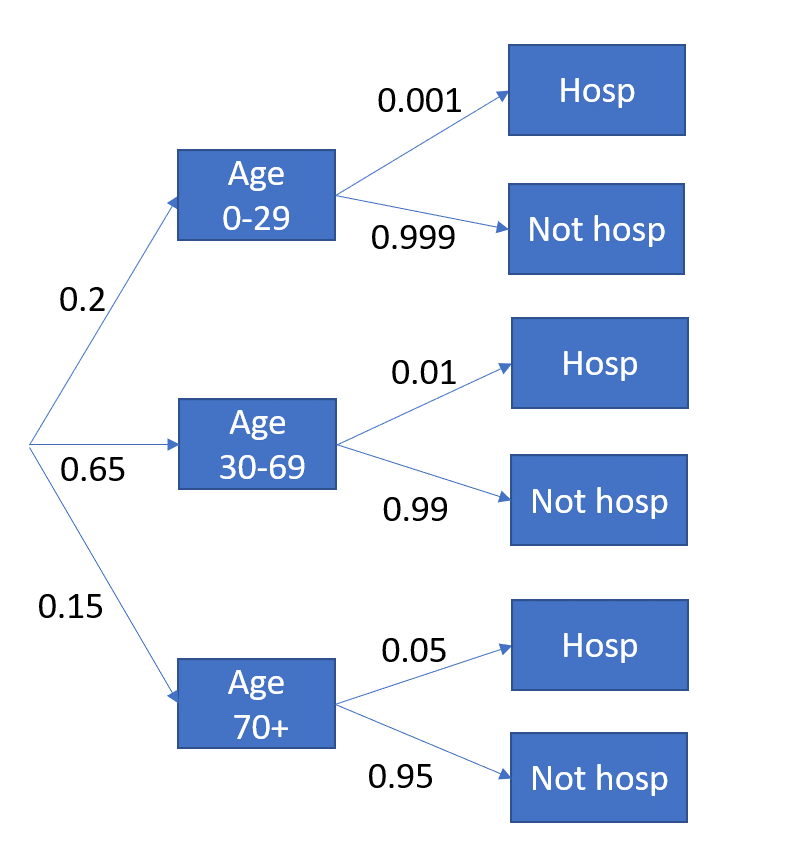
Fig. 8 Probability tree for hospitalisation with COVID-19 by agegroup, Quiz 5, questions 8-10

Question 9

Following the methods of the previous question, we have

\[\begin{split} \begin{align*} Pr(Age_{30+} \cap H) & = Pr(Age_{30-69}) Pr(H | Age_{30-69}) + Pr(Age_{70+}) Pr(H | Age_{70+}) \\ & = 0.65 \times 0.01 + 0.15 \times 0.05 = 0.014 \end{align*} \end{split}\]

Question 10

\[\begin{split} \begin{align*} Pr(H) & = Pr(H \cap Age_{0-29}) + Pr(H \cap Age_{30-69}) + Pr(H \cap Age_{70+}) \\ & = Pr(Age_{0-29}) Pr(H | Age_{0-29}) + Pr(Age_{30-69}) Pr(H | Age_{30-69}) + Pr(Age_{70+}) Pr(H | Age_{70+}) \\ & = 0.2 \times 0.001 + 0.65 \times 0.01 + 0.15 \times 0.05 = 0.0142 \end{align*} \end{split}\]