8.2 The p-value
The p-value is defined as the probability of observing the sample estimate or a more extreme one (in either direction) given that the null hypothesis is true.
The smaller the p-value, the lower the chance of getting a difference as big as the one observed if the null hypothesis is true.
Therefore, the smaller the p-value, the stronger the evidence against the null hypothesis.
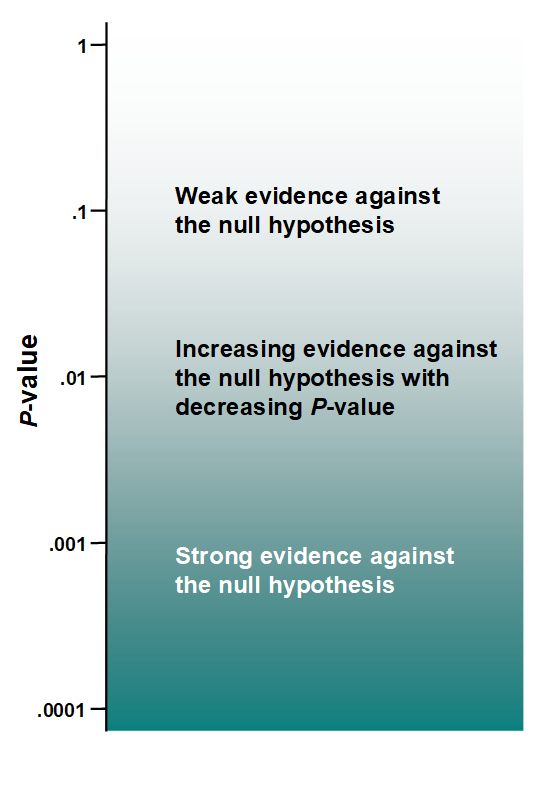
Fig. 3 Interpretation of p-values (taken from Sterne & Davey-Smith)
The value of 0.05 has historically been used as a cut-off, with values of \(p<0.05\) deemed “statistically significant” and values of \(p\geq 0.05\) “not significant”. As discussed further in a later sub-section, we do not recommend dichotomising p-values in this way.
Note that:
- We have described what is called a two-sided test. Occasionally, a one-sided test might be used, where the p-value is the probability of results that are as extreme, or more extreme, in the same direction as the observed result. However, it is rare that it is justifiable to ignore sample statistics in one direction, so we will focus on two-sided tests.
- When the sampling distribution is not symmetric, it can be hard to define what is as extreme as the estimate we have seen. In this case, there are various ways of obtaining the two-sided p-value. We do not pursue this further.